
How to view your gym's statistics in RoninBox
Published on
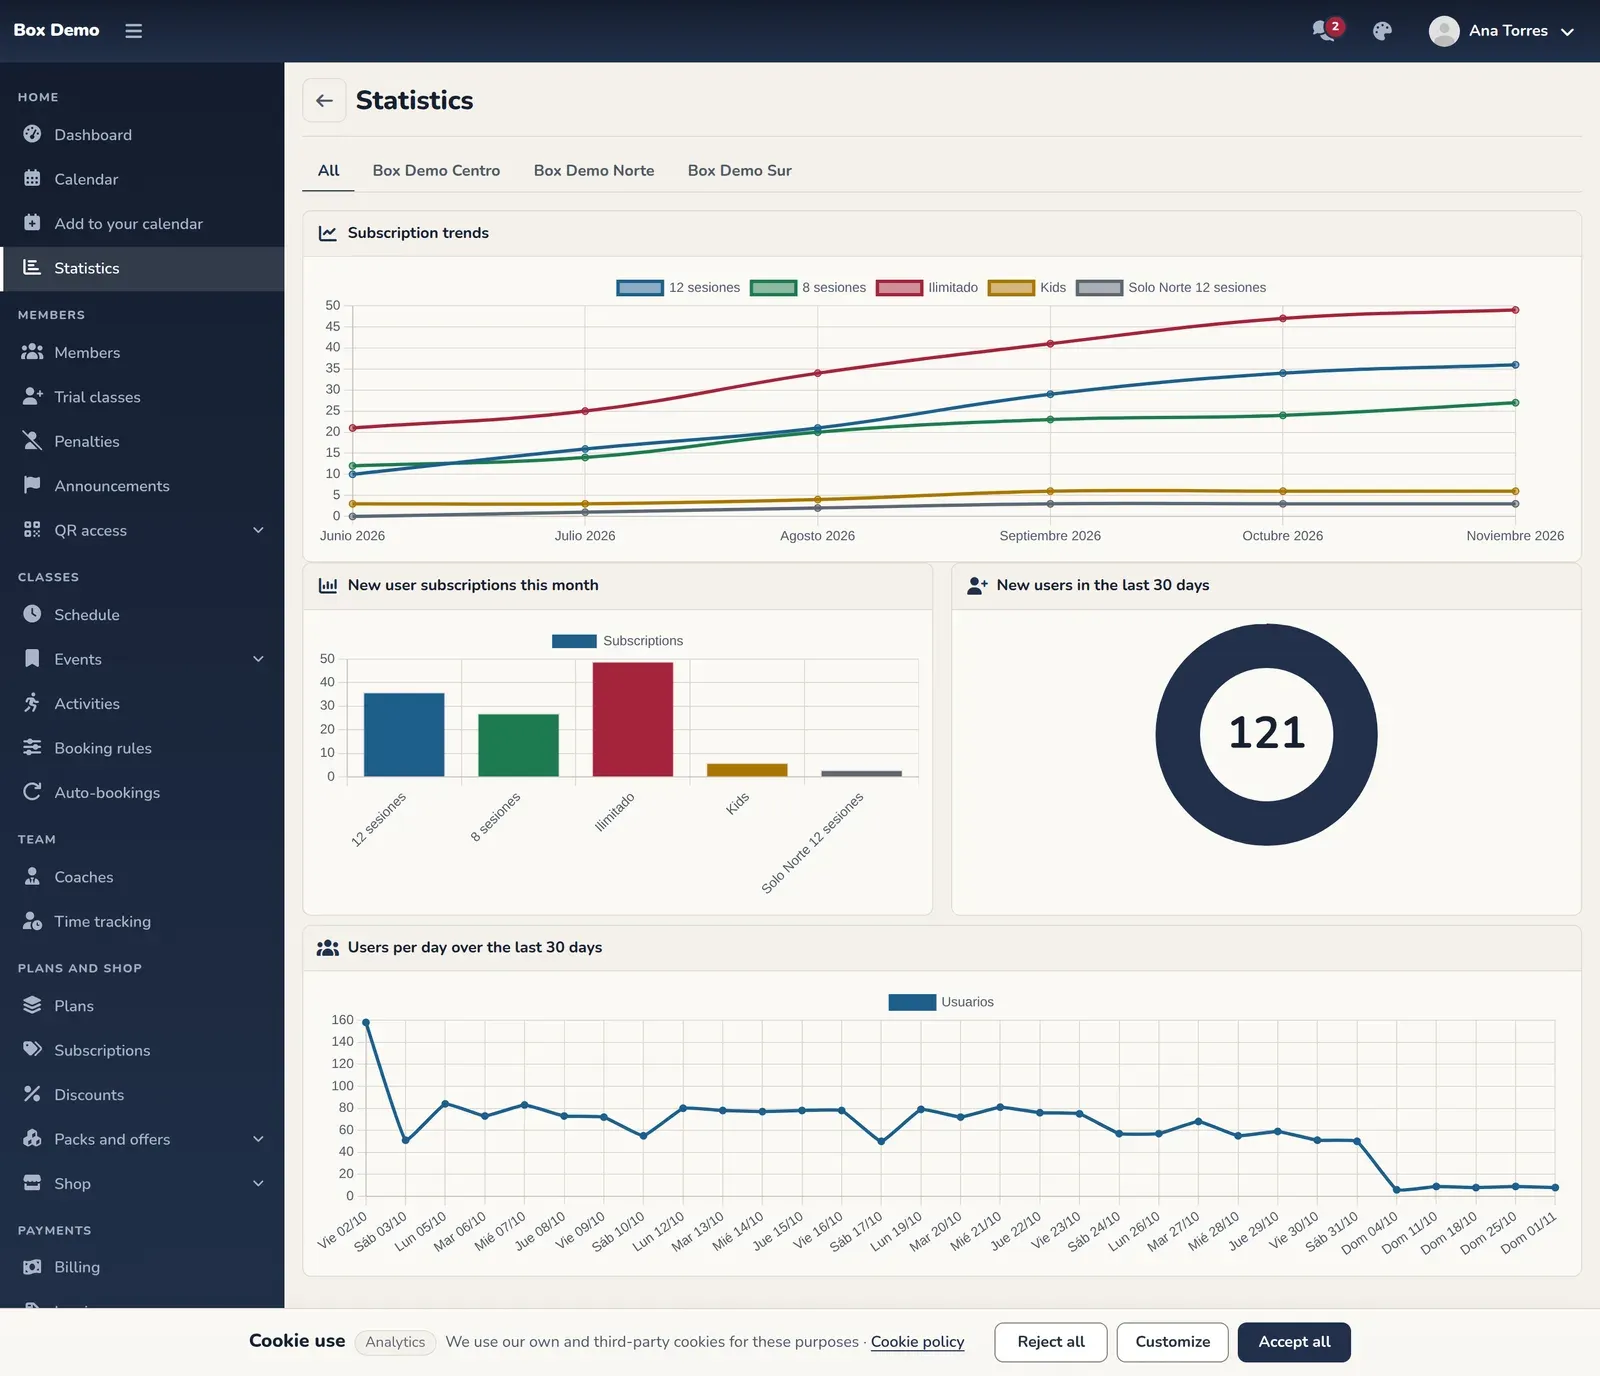
To view your gym’s statistics in RoninBox, open Statistics in the side menu. The screen brings together four charts about the gym’s plans and users, and there is nothing to set up.
What each chart shows
Section titled “What each chart shows”- Subscription trends: one line per plan with the number of monthly fees each month. Class passes are not counted.
- New user subscriptions this month: a bar chart with this month’s subscriptions that belong to new members, one bar per plan.
- New users in the last 30 days: a circular gauge with the number of new users in the last month. The gauge’s maximum is the gym’s total number of active users.
- Users per day over the last 30 days: a line with the number of users signed up for classes each day over the last 30 days.
If your gym has several locations
Section titled “If your gym has several locations”When there are two or more visible locations, the screen shows an All tab and one tab for each location. Each tab repeats the four charts with that location’s data. Locations are created in Locations.
Common issues
Section titled “Common issues”- I don’t see any tabs. They only appear if the gym has two or more visible locations.
- The charts take a second to appear. They load when you open the screen and are drawn with a short animation.